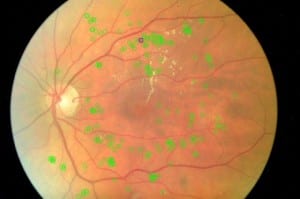
 NUMBER AND LOCATION OF LESIONS FOR THE OPTIMIZATION OF THE EXAMINATION INTERVAL IN DIABETIC RETINOPATHYA recent study concluded that it is possible to construct a model for optimising the examination interval during screening for diabetic retinopathy in low-‐risk patients. However, the model fails to predict the interval for patients in whom the primary assessment recommended a short screening interval, suggesting that more risk factors should be identified and included. Two sets of fundus photographs, one where the result of the model and recommended interval are concordant and one where they are discordant, were analysed. The number of different lesions and their centre position (see fig. 1) with regards to the areas defined on a previous study (see fig. 2) were stored in an array of features associated with the relative fundus photo (see table 1). Considering the concordance and discordance on the interval as the two possible values of a dependent variable in a classification problem, an extraction of the best isolated features and a 10-‐fold cross validation were performed to assess their significance. The feature selection chose as the two best isolated features the number and the percentage of small haemorrhages in two different areas respectively. The 10-‐fold cross validation performed extracting the first two ranked features only resulted in the correct classification of 64% of the instances. With these two sets the ranking of the feature selection matched the clinicians’ experience while the percentage of correct classifications suggested that the model would benefit from the information held in the location and number of small haemorrhages showing on fundus photography.